
Project 5 Titanic

One of the most deadliest commercial maritime disasters ocurred on April 15, 1912 when the the RMS Titanic sank on its maiden voyage after hitting an iceberg. As a result, the International Convention for the Safety of Life at Sea (SOLAS) was established in 1914. It governs, even today, many of the safety maritime protocols (e.g. wirless communication, iceberg patrols and documentation). There has been no death or loss of property due to any collisions with icebergs, because of these regulations being enacted.+ The Titanic tragedy forced authorities to rethink how we sailed, but can the data attained from the tragedy help us to predict survival rate of a future and similar disaster? This blog post is about exactly that.
The “Ground Truth” training data featured 10 data points of the Titanic tragedy for all passengers who boarded the liner; 891 unique observations of passenger identification number. Those fields include: ticket class, passenger gender, passenger age, the number of siblings/spouses who boarded, number of parents/children who boarded the ship, the ticket number, fare paid by passnger, port of embarkation (Cherbourg, Southamton, Queenstown), the cabin number and survival notation (0=perished, 1=survived).
The data tells us that the survival rate was about 38.4%, where 342 people survived. The majority of those who boarded the liner were male, a 65:35 ratio, where male average age was 30.7 and female was 27.9 years old. Most of those who boarded the Titanic purchased 3rd class tickets (491). 216 first-class tickets were purchased, averaging £84.15 (or £7,026 today). The majority of passengers embarked at Southampton, England. 17 passengers under 20 years old perished in the accident.
One notable ascept of the data is that 177 passengers are missing age values. This logistic classification model assumes that those passengers missing age values had a value of the mean age (29.7) of all available passenger age. My process imputed mean value for those missing values. Other assumptions made in the model is that I dummified the gender (0=male, 1=female) and port of embarkation features (1=Southampton, 2=Cherbourg, 3=Queenstown). The point here is an attempt to capture categorical characteristics of the data. Another assumption of the model of the model is that I standardized all interger features by subtracting the mean and dividing by the standard deviation. Doing so places all of these features on a similar scale. Moreover, the initial logistic regression model included: passenger class, passenger age, number of passenger sibling, number of passenger parents and children, ticket, gender, and point of embarkation. Finally, I performed a train-test split approach by segrating training and test data by a ratio of 67:33.
My modeling approach was to build a logistic regression model by regularizing in order to trade-off bias versus variance. I create a k-nearest neighbor model and optimize it using Gridsearch. I also build decision trees and emsembles models in order to approach the modeling process from a less parametric purview. Evaluation of these models are also provided.
Let’s now take a look at our logistic regression results and how well the model performed. The first positive indication of the classification model was the lower mean squared error of 0.24, which normally means minimized variance between the model and predictions. Next, I reviewed a classification report, where the precision rate is 0.79. Precision rate indicates the number actual positives observations over true positive and false positives. Accuracy Scores from k-nearest neighbors procedure also produced a 78.6 percent. The logistic regression pointed to ticket fare, sex and port of embarkation being the most significant features.
Other steps taken included refining the model by creating Lasso and Ridge Regression models, cross validating the best result model on the held out test sets, and finding an optimized C in an L1 model. Interestingly, the Lasso regression approach did not remove any of the features of the logistic regression. Ticket fare, sex and port of embarkation were the most significant features in both L1 and L2 this model. However, it did slighlty increase coefficient mean to 0.793 for both L1 and L2 regression models. After performing a gridsearch to find the best possible regularization model, the L2 Cross Validation score 0.80 at C=0.1 was the best model.
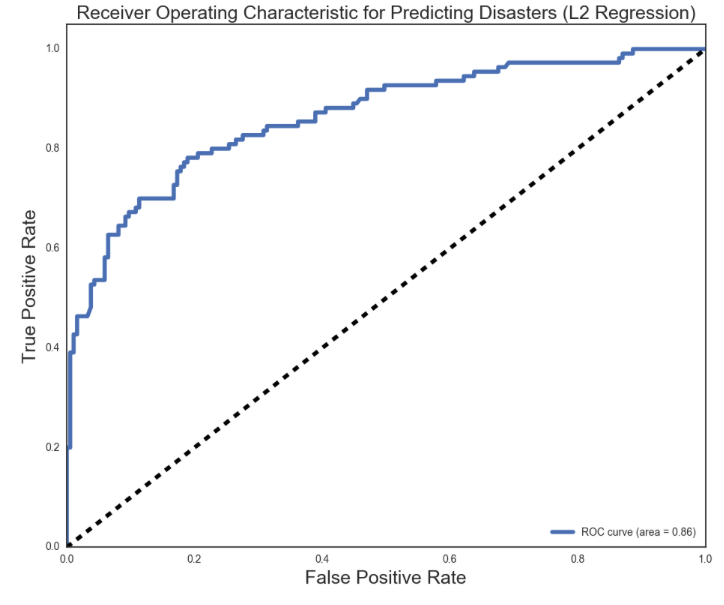
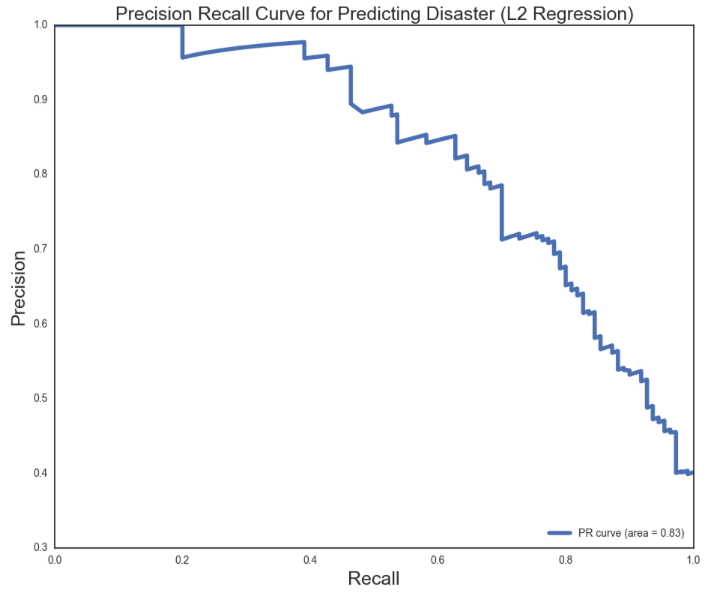
A graphical representation of the effectiveness of the Logistic Model is the ROC Curve, that optimally captures an ideal 99 percent of the area under the curve. The ROC curve for the L2 Logistic Regression captured an 86 percent of the area under the curve when looking at true positive rate and false positive rate. Similarly, the precision recall curve also captured a favorable 0.83 out of 1.00.
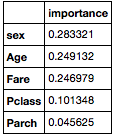
So far, we have resorted to traditional logistic regression models and means to reduce the variance / bias trade-off. My next approach is to use decision trees and ensembles to see if there are other features that may be significant to building a model that is about to predict survival rate. A decision tree finds the best breaks between each category or feature in the data set. Creating a decsion tree based on the Titanic data yielded feature importance of sex at 0.63 relative as the largest contributor to the other features ticket class and to a lesser extent age, fare and number of siblings. When considering other non-parametric models that perform bootsrapping, that is creating a model from a random re-sample or those that model on “weak learners” by boosting, the best ensemble model to perform was extra trees that yielded a 0.795 cross validation accuracy score with a 0.05 error. That model evenly divided coefficient values of 0.02 between the more significant features: Sex, age and fare.
Final conclusions are: Between a logistic regression model and the non-parametric ensembles, what you pay for a ticket and your gender do play a role in survival rate for disaster management. Where the logistic regression model would find gender and where you start your journey as important features, the extra trees model finds age more important but is a more simple model. Both models perform well, with respect to accuracy scores, precison and recall and ROC calculations.
+https://en.wikipedia.org/wiki/RMS_Titanic#Cultural