
Project 4 Indeed

I am currently a Data Science Immersive student at General Assembly in New York. It is a 12-week "accelerator" program designed to supply its students with the toolkit and experience to become a data scientist. As my graduation date approaches, I will be actively searching for a new gig, likely online job boards like indeed.com. Indeed advertises as such on their site, "As the world’s #1 job site, with over 200 million unique visitors every month from over 60 different countries, Indeed has become the catalyst for putting the world to work." So I have decided to put some of my skills to the test. I will scrape (or retrieve data from) the Indeed.com website of it’s job employment data, particularly for a search on "Data Scientist" across several American cities. My aim is to be able to build a logistic regression model that will predict the categorical salary for those postings without salary listings and based on those salaries given for "Data Scientists." This blog is my journey and experience as I built my predictive model.
My scrape was able to pick up about 1,500 non-unique job posting altogether, of which only 87 contained salary information. These posting were reduced 798 for all "Data Scientist" posting from the following cities: (New York’, ‘Cambridge’, ‘Chicago’, ‘San Francisco’, ‘Seattle’,’Austin’, ‘Atlanta’,’San Diego’,’Los Angeles’,’Washington’,’Philadelphia’,’Palo Alto’,’South San Francisco’,’San Jose’). I was concerned with getting job title, hiring company, job location, job salary (where offered) and a short job description. I did not have enough salary data with which to train my model. Given additional time to supplement this study, I would scrape glassdoor.com for additional salary information, if it exists. However, this is a risk and assumption incorporated into my model, especially after I split my training and test data, 67:33.
Exploratory Data Analysis yielded removal of duplicates by job title, company, and job location, as mentioned above. EDA also yielded work surrounding the target feature, salary. Since some of the aalary was given in hours, month and in ranges of annual salary, I was required to clean up the salary data accordingly. Once cleaned up, I used the nationwide mean salary ($96,382) as my bar to determine what constituted "Above average" vs "Average" salary. I denote "above average" as 1 and average as 0 in my target variable.
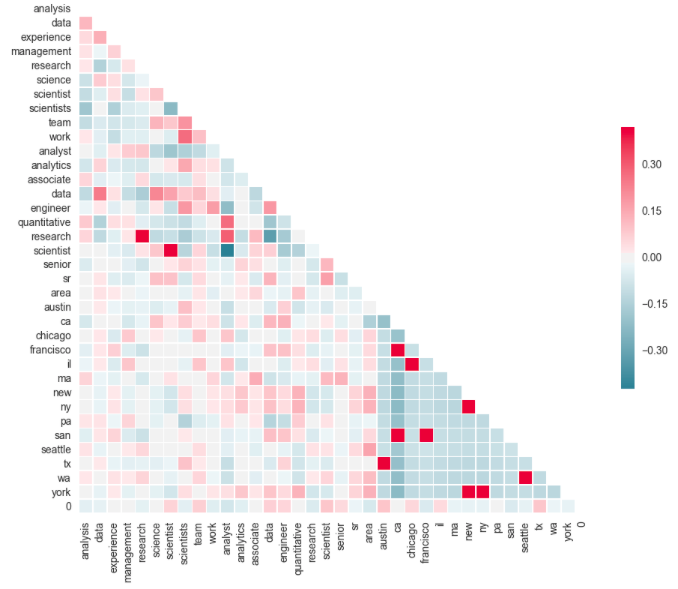
Now, how would I organize my independent variables for the predictive logistic model, given I had all categorical features: job title, employer, job location and brief description of job description? Well, I employed Sklearn’s Count Vectorizer to tell me the most common words in the job description, location (due to unnormalized data) and job title. Using this Sklearn function is considered a form of dummifying these stated variables. Top 10 most frequent words for Location did not yield much of a suprise, as it dummified (made binary 0/1) largest cities scraped by name (Chicago, NY, Los Angeles, Palo Alto, Austin Texas). Now just at face value, the Count Vectorizor picked up fairly broad top 15 words: management, science, research, analysis, experience. But taken in context with top 10 words found in job title and in context of a correlation matrix (see below), several themes do arise. For example, for Data Scientist postings, there is a sharper inverse relationship between the job description words of "scientist" and "analyst." Additionally, the data scientist role is widely correlated to more "senior/sr", "experienced", "engineering and "management" requirements. In total I engineered 35 features for my logistic model.
Let’s now take a look at our regression results and how well the model performed. The first indication of a good model was the lower mean squared error of 0.04, which normally means minimized variance between the model and predictions. Next, I reviewed a confusion matrix, where the rows indicate Actual Job Postings ("0") for Salaries Below Nationwide Data Scientist Salaries versus Predicted Job Postings (Column="1") for Data #Scientists below Nationwide Average Logistic Regression Model LR_Model predicted all 256 Postings that were actually Below Nationwide Average. LR_Model did, however, fail to classify 8 Job Postings that were actually above Nationwide Mean Salary (or denoted as "1"). Yet overall, where Precision score, which indicates the model rarely mistakenly misclassifies above or below Salary mean, is 94 percent. Cross validated Accuracy Scores also produced favorable mean 96 percent.
Other steps taken include refining the model by creating Lasso and Ridge Regression models, cross validating the best result model on the held out test sets, and finding an optimized C in an L1 model. I received equally favorable results about above. Please review finer details in my juptyer notebook.
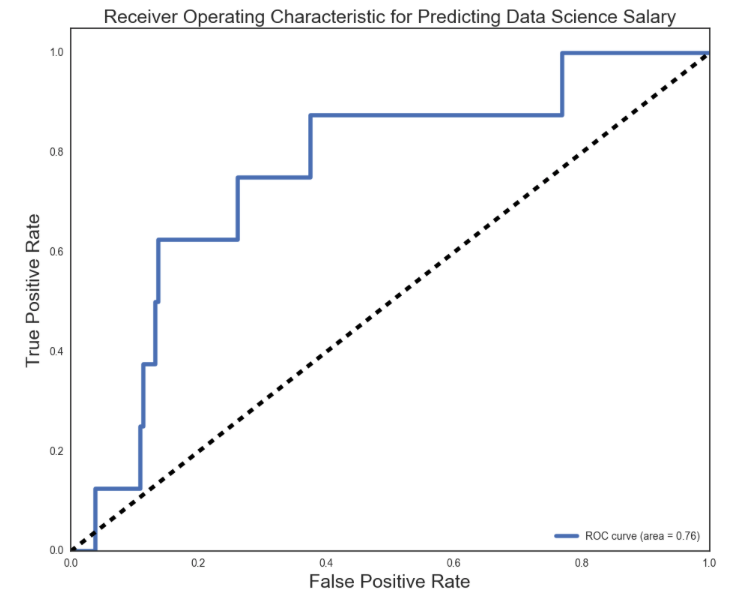
A graphical representation of the effectiveness of the Logistic Model is the ROC Curve, that optimally captures an ideal 99 percent of the area under the curve. By ROC curve captures 76 percent of the area under the curve when looking at true positive rate and false positive rate.
Final conclusions are: there was not enough Indeed.com salary data for "Data Scientists" with which to model robustly. I would like to supplement my data with another job board such as glassdoor.com. Another conclusion is that keeping the model more simpler worked better: I tried to dummify all Location values and my ROC curve (TP vs FP) suffered in the area under the curve. In that case my features ballooned to over 200 variables. However, despite the lack of salary, the features jobtitle, job text, hiring company and job location are all sufficient to predict salary categorically.