
Project 3 Ames Blog Text

In 2010 CNN Money.com listed Ames, Iowa as one of the 10 Best Cities to live in the U.S. After all, it is home to Iowa State University that employes 10,000 folks. Median family income, in 2014, is a shade about $77,400. Ames is also home to world class corporations like 3M, Barilla, Syngeta and other companies. Moreover, CNN had this to say about the city population 62,000 as of 2010 U.S. Census: “For Midwest partisans who like the buzzy feel of a big college town, Ames is a perfect fit.”+
Could we reasonably predict home prices in Ames given 19 characteristics that describe everything from a subjective Overall Quality / Overall Condition to Lot Size, number of bathrooms, Year home was built and remodelled, etc.? The answer is Yes. This blog post is a brief journey through how I built a linear regression model to help predict real estate prices. Additionally, I describe these data, discuss supplementing my model by feature engineering, point out model evaluation techniques usch as Lasso and Cross Validation Ridge Regression and describe two linear regression models that I tested.
The following feature were considered in building the Linear Regression Model, where the last field SalePrice is the target variable: • LotArea: Lot size in square feet • Utilities: Type of utilities available • Neighborhood: Physical locations within Ames city limits • BldgType: Type of dwelling • HouseStyle: Style of dwelling • OverallQual: Overall material and finish quality • OverallCond: Overall condition rating • YearBuilt: Original construction date • YearRemodAdd: Remodel date • RoofStyle: Type of roof • RoofMatl: Roof material • GrLivArea: Above grade (ground) living area square feet • FullBath: Full bathrooms above grade • HalfBath: Half baths above grade • Bedroom: Number of bedrooms above basement level • Kitchen: Number of kitchens • MoSold: Month Sold • YrSold: Year Sold • SalePrice - the property’s sale price in dollars (target variable)
Key Facts About the Data:
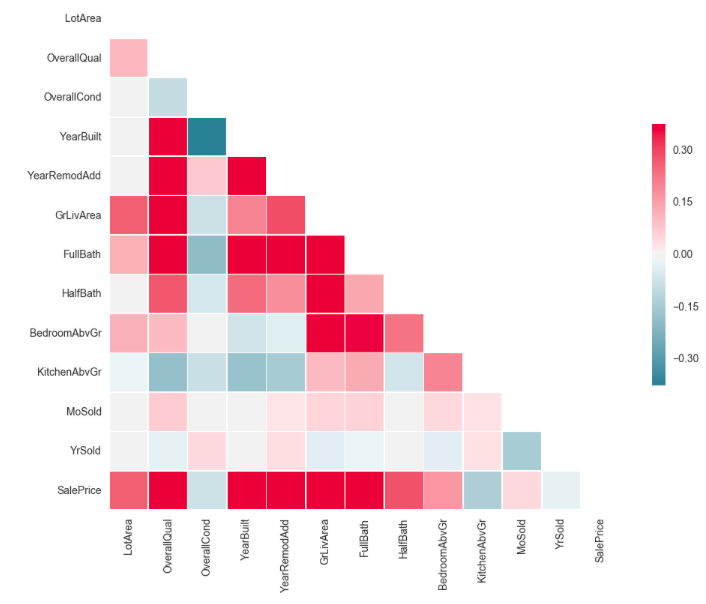
- Given a correlation matrix, where a correlation coefficient closer to one indicates a stronger relationship between features, we find that 7 fields have a stronger relationship to the SalesPrice target variable. Those fields are: LotArea, Overall Quality, Year Built, YearRemodelledAdd, GrLivArea, Full bathroom, half bathroom indicators. My final linear regression model incorporates these variables and others to total 55 features.
-
Of the 25 neighborhoods in Ames, real estate sales prices are highest in NoRidge ($335K), NridgHt($316K), StoneBR ($310K), and lowest in BrDale($104K),IDOTRR($100K), MeadowV ($99K) on average.
-
The highest homes sold in Ames has a price of $755K. 28 homes sold for more than $400K.
-
Looking over years 2006 to 2010, the average real estate prices across all neighborhoods in Ames, Iowa is about $180K. There is a notable 5% drop in average real estate prices between years 2007 ($186K) to 2008 ($177K) perhaps reflecting the national subprime crisis of 2008. More investigation would be necessary here, however.
-
Ames, Iowa contains 2.5 family home (finished) averaging $220K (highest) in sales price but composing of only 8 of these units.
-
Ames, Iowa is primarily composed of 2-story homes (445 units) and average $210 in sales price.
-
NAmes has the most units in any neighborhood in Ames with 225 units.
-
Blueste has the least units in Ames with 2 units that average $137K.
-
Roof style gable makes up 78% of all homes in Ames neighborhoods.
Methodology:
I wanted to capture the significance of neighborhood in my model, specifically I wanted to quantify and distinguish between neighborhoods with higher average sales prices and lower prices. Therefore I approached the problem by creating two model and comparing their R-squared results for the better model. The first model (R-squared 0.77) would take a sorted list of neighborhood/sales prices and divide by 25 percentile groups of 4 as a dummy variable. The second model, and the better of the two (R-squared 0.82), made a dummy variable of each neighborhood, dropping all but one to avoid the dummy variable dilemna. I did create dummy variables that accounted for Roofstyle and HouseStyle for both versions of the model. I standardized all numeric independent variables by subtracting the mean and dividing by the standard deviation. Those standardized fields are: Lot Area, Overall Condition, Overall Quality, year built, year home remodelled, living area, bathrooms (full and half), bedroom area and kitchen area. I did implement a train / test split, holding out 33% (442 observations) of all my data for testing after I trained my model.
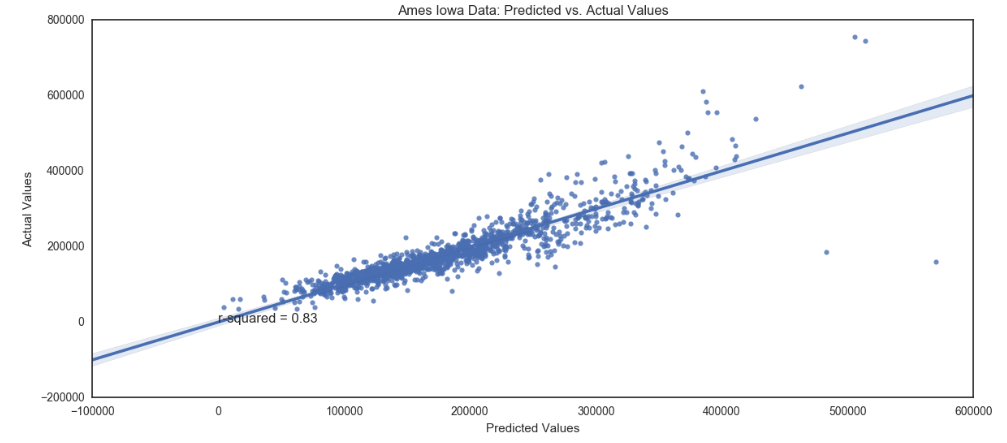
Results: Initial linear regression model results yielded an R-squared of 0.826 using statsmodel and sklearn. Actual versus predicted points are graphically represented here.
In order to strike a better balance between bias and variance but penalize the model for the data being held out I then performed an L1 Lasso Regression and Ridge Cross Validation Regression. By nature the Lasso Regression technique eliminates features in the newly fit model. My model lost only one feature NWAmes dummy variable in the L1 Lasso version, but kept to an R-squared similar to the standard linear regression 0.826. The mean squared error and mean absolute coefficient do drop between the models thus ensuring a better model with which to receive test data. Next step was to use both the Lasso model and the original linear regression model through the held out test data set, where I received an 0.83 R-squared, much better than any model results up to this point. Next step was to apply the Cross Validation Ridge (R2) Regression technique to our model and on training data, across a varity of alpha variables. R-sqaured for the Ridge model on the traiing dataset is 0.824. Although the overall results and changes in R-squared is one or two percent points, the over all result is that the original linear regression model on the test data.
Here is the model with coefficients and intercept: [(‘LotArea’, 6236.1267985942723), (‘OverallQual’, 20263.231122123965), (‘OverallCond’, 7004.6832087591492), (‘YearBuilt’, 11102.956360652333), (‘YearRemodAdd’, 1548.158784288622), (‘GrLivArea’, 39126.733001551467), (‘FullBath’, 1860.7944804411841), (‘HalfBath’, 3634.6066071243508), (‘BedroomAbvGr’, -3221.7779048100529), (‘KitchenAbvGr’, -4617.2458354290175), (‘MoSold’, -396.15864558379326), (‘YrSold’, -288.62180684515261), (‘HouseStyle_1.5Unf’, 15068.875836784759), (‘HouseStyle_1Story’, 22119.051126442577), (‘HouseStyle_2.5Fin’, -23007.619679853869), (‘HouseStyle_2.5Unf’, -12604.980319097725), (‘HouseStyle_2Story’, -6256.2254725627536), (‘HouseStyle_SFoyer’, 28184.815567179325), (‘HouseStyle_SLvl’, 14588.278408505739), (‘RoofStyle_Gable’, -2611.7020991115351), (‘RoofStyle_Gambrel’, 3557.7875190411655), (‘RoofStyle_Hip’, 5108.1810421273758), (‘RoofStyle_Mansard’, -6071.354425101089), (‘RoofStyle_Shed’, -2787.8899836819646), (‘Neighborhood_Blueste’, -2827.3387105958109), (‘Neighborhood_BrDale’, -4888.1478630899182), (‘Neighborhood_BrkSide’, 20015.047004308897), (‘Neighborhood_ClearCr’, 22851.856714724221), (‘Neighborhood_CollgCr’, 19091.967748451301), (‘Neighborhood_Crawfor’, 34235.982406183139), (‘Neighborhood_Edwards’, 38.364724680612426), (‘Neighborhood_Gilbert’, 12765.800068696932), (‘Neighborhood_IDOTRR’, 8965.6794334536753), (‘Neighborhood_MeadowV’, -970.40461089119526), (‘Neighborhood_Mitchel’, 10261.00340102084), (‘Neighborhood_NAmes’, 8713.5461906063283), (‘Neighborhood_NPkVill’, 5543.061811807338), (‘Neighborhood_NWAmes’, 1403.29092014964), (‘Neighborhood_NoRidge’, 69039.100248139584), (‘Neighborhood_NridgHt’, 74103.705367616116), (‘Neighborhood_OldTown’, 5659.3715641740509), (‘Neighborhood_SWISU’, 5652.6801347757801), (‘Neighborhood_Sawyer’, 7732.3384282646575), (‘Neighborhood_SawyerW’, 12387.510050153454), (‘Neighborhood_Somerst’, 30290.217702789698), (‘Neighborhood_StoneBr’, 73900.970130561051), (‘Neighborhood_Timber’, 26075.353301964282), (‘Neighborhood_Veenker’, 40085.284075694122)] + ‘Intercept’, 735253.53
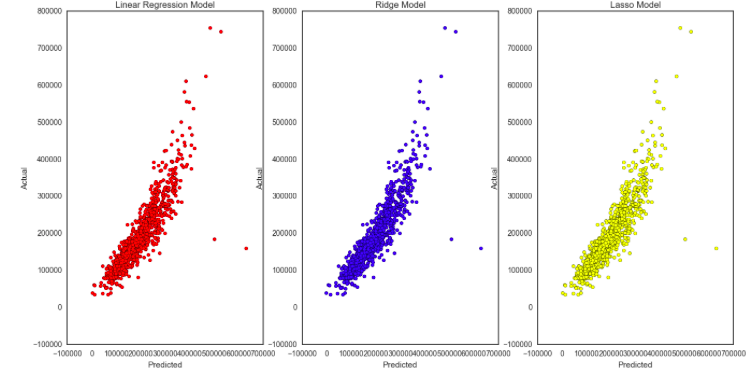
Below is a graphical representation of LR vs Lasso vs Ridge Regression Models.
- http://time.com/money/collection-post/3312316/ames-iowa-best-places-to-live/