
Project 1 Sat Scores

The College Board will tell you that the SAT is not a measure of a student’s achievement, but it is rather a good predictor of a student’s success in college or university. However, given SAT results from the test administered in 2001, could we describe these results and determine if there is a normal distribution in scores? Or is there reasonable relationship between the results that could help us to train data and produce a linear model with which to predict future SAT results?
A couple of notes on assumptions of this data set are: 1) removed the “All” (51st) row from descriptive data analysis. It was intended to summarize the nationalresults. 2) did not consider the linear relationship between the Verbal SAT score and the Total SAT score since the Verbal makes up half of the total score.
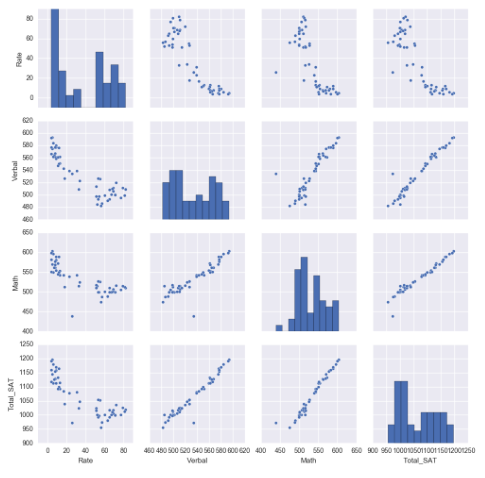
My results find that there is a reasonable positive linear relationship between Verbal and Math SAT scores. That is, as Verbal scores increase, Math SAT scores also increase proportionally. Please see the Seaborn pairplot, here.
I also performed further hypothesis testing, examining whether to reject or fail to reject the null hypothesis where there is no difference between the Math and Verbal SAT scores. Using a significance interval (an alpha) of 0.01, my probability value fell greater than the alpha thus allowing me to reject the null hypothesis. In otherwords, we reject that there is no difference between the Mat and Verbal SAT scores and accept the alternative hypothesis that there is a diference between the two SAT scores.
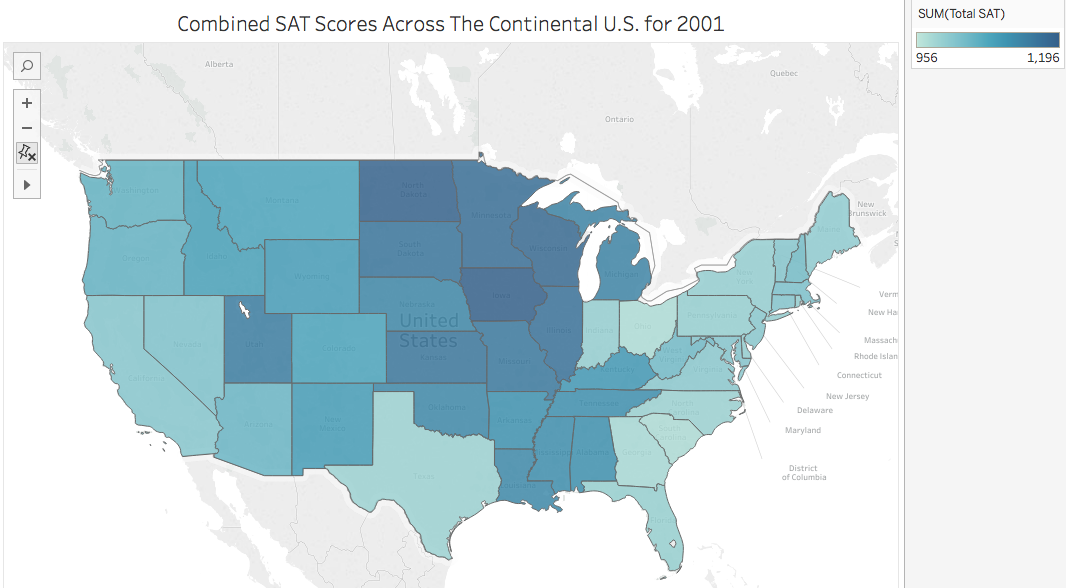
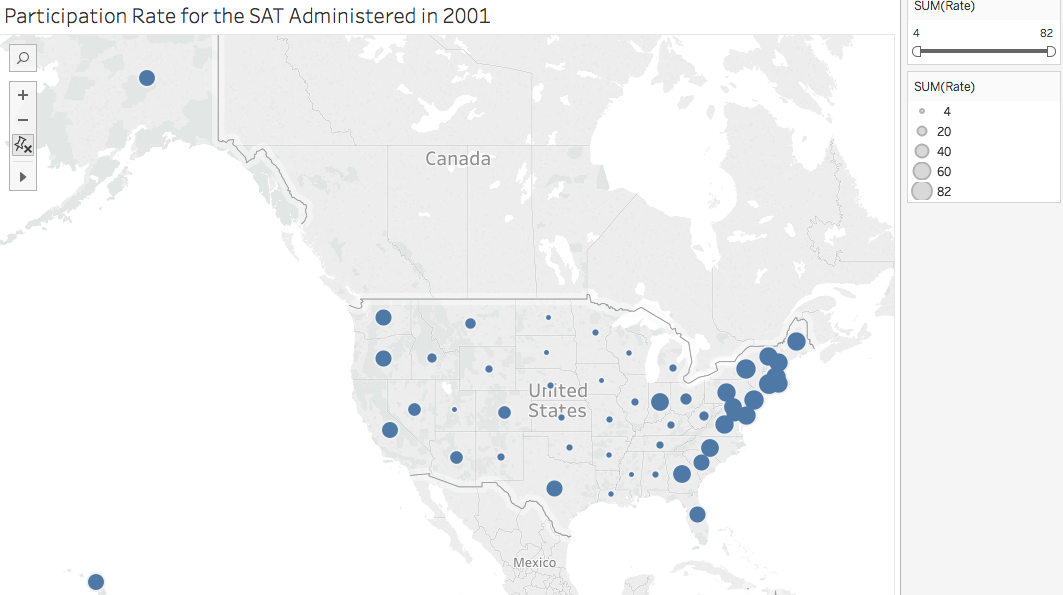
These data (Math and Participation Rate) are positively skewed, that is the mean exceeds the median and mode, while the Verbal SAT scores are negatively skewed (or where median mode exceed the mean. Moreover, examining a heatmap/cloropleth showing total SAT scores shows higher overall scores in mid-western states than in costal states, there are more exam takers in those costal states than in the mid-western states. This information seems to suggest perhaps costal states may have a different linear model than one of mid-western states.
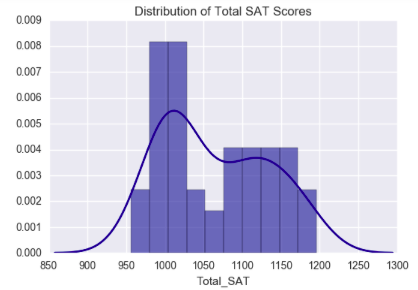
Final Conclusions are that one can predict either Math or Verbal variables in a classification or linear regression model due to the positive linear relationship. Hypothesis testing helped to dispell any doubt. Furthermore, even though the scores data is skewed (right in the case of Math and participation rate; left skewed for Verbal) one can assume a normal distribution and build a model on this data.
Please find the link in my Github account to the Jupyter notebook for more details.