Project 6 Imdb


Data Scientist

One of the most deadliest commercial maritime disasters ocurred on April 15, 1912 when the the RMS Titanic sank on its maiden voyage after hitting an iceberg. As a result, the International Convention for the Safety of Life at Sea (SOLAS) was established in 1914. It governs, even today, many of the safety maritime protocols (e.g. wirless communication, iceberg patrols and documentation). There has been no death or loss of property due to any collisions with icebergs, because of these regulations being enacted.+ The Titanic tragedy forced authorities to rethink how we sailed, but can the data attained from the tragedy help us to predict survival rate of a future and similar disaster? This blog post is about exactly that.
The “Ground Truth” training data featured 10 data points of the Titanic tragedy for all passengers who boarded the liner; 891 unique observations of passenger identification number. Those fields include: ticket class, passenger gender, passenger age, the number of siblings/spouses who boarded, number of parents/children who boarded the ship, the ticket number, fare paid by passnger, port of embarkation (Cherbourg, Southamton, Queenstown), the cabin number and survival notation (0=perished, 1=survived).

I am currently a Data Science Immersive student at General Assembly in New York. It is a 12-week "accelerator" program designed to supply its students with the toolkit and experience to become a data scientist. As my graduation date approaches, I will be actively searching for a new gig, likely online job boards like indeed.com. Indeed advertises as such on their site, "As the world’s #1 job site, with over 200 million unique visitors every month from over 60 different countries, Indeed has become the catalyst for putting the world to work." So I have decided to put some of my skills to the test. I will scrape (or retrieve data from) the Indeed.com website of it’s job employment data, particularly for a search on "Data Scientist" across several American cities. My aim is to be able to build a logistic regression model that will predict the categorical salary for those postings without salary listings and based on those salaries given for "Data Scientists." This blog is my journey and experience as I built my predictive model.
My scrape was able to pick up about 1,500 non-unique job posting altogether, of which only 87 contained salary information. These posting were reduced 798 for all "Data Scientist" posting from the following cities: (New York’, ‘Cambridge’, ‘Chicago’, ‘San Francisco’, ‘Seattle’,’Austin’, ‘Atlanta’,’San Diego’,’Los Angeles’,’Washington’,’Philadelphia’,’Palo Alto’,’South San Francisco’,’San Jose’). I was concerned with getting job title, hiring company, job location, job salary (where offered) and a short job description. I did not have enough salary data with which to train my model. Given additional time to supplement this study, I would scrape glassdoor.com for additional salary information, if it exists. However, this is a risk and assumption incorporated into my model, especially after I split my training and test data, 67:33.
Exploratory Data Analysis yielded removal of duplicates by job title, company, and job location, as mentioned above. EDA also yielded work surrounding the target feature, salary. Since some of the aalary was given in hours, month and in ranges of annual salary, I was required to clean up the salary data accordingly. Once cleaned up, I used the nationwide mean salary ($96,382) as my bar to determine what constituted "Above average" vs "Average" salary. I denote "above average" as 1 and average as 0 in my target variable.
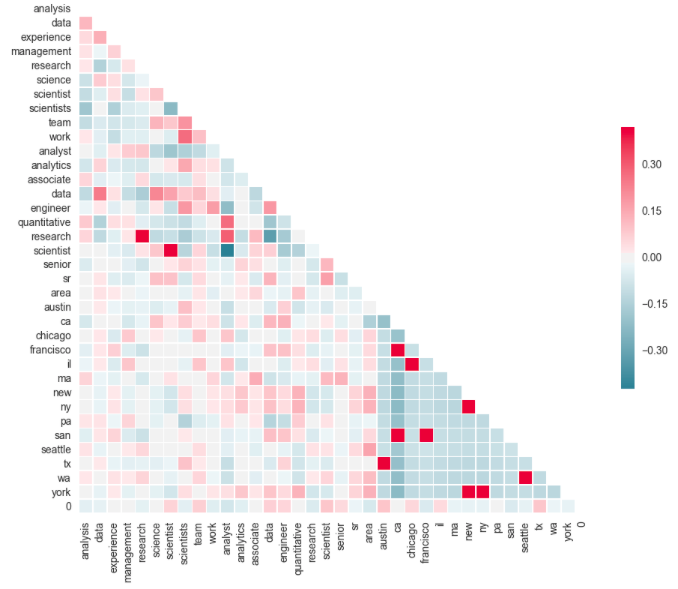
Now, how would I organize my independent variables for the predictive logistic model, given I had all categorical features: job title, employer, job location and brief description of job description? Well, I employed Sklearn’s Count Vectorizer to tell me the most common words in the job description, location (due to unnormalized data) and job title. Using this Sklearn function is considered a form of dummifying these stated variables. Top 10 most frequent words for Location did not yield much of a suprise, as it dummified (made binary 0/1) largest cities scraped by name (Chicago, NY, Los Angeles, Palo Alto, Austin Texas). Now just at face value, the Count Vectorizor picked up fairly broad top 15 words: management, science, research, analysis, experience. But taken in context with top 10 words found in job title and in context of a correlation matrix (see below), several themes do arise. For example, for Data Scientist postings, there is a sharper inverse relationship between the job description words of "scientist" and "analyst." Additionally, the data scientist role is widely correlated to more "senior/sr", "experienced", "engineering and "management" requirements. In total I engineered 35 features for my logistic model.
Let’s now take a look at our regression results and how well the model performed. The first indication of a good model was the lower mean squared error of 0.04, which normally means minimized variance between the model and predictions. Next, I reviewed a confusion matrix, where the rows indicate Actual Job Postings ("0") for Salaries Below Nationwide Data Scientist Salaries versus Predicted Job Postings (Column="1") for Data #Scientists below Nationwide Average Logistic Regression Model LR_Model predicted all 256 Postings that were actually Below Nationwide Average. LR_Model did, however, fail to classify 8 Job Postings that were actually above Nationwide Mean Salary (or denoted as "1"). Yet overall, where Precision score, which indicates the model rarely mistakenly misclassifies above or below Salary mean, is 94 percent. Cross validated Accuracy Scores also produced favorable mean 96 percent.


Next you can update your site name, avatar and other options using the _config.yml file in the root of your repository (shown below).